Your New Detailed 2021 “Year End” Real Estate Summary for London & St. Thomas
Tuesday Feb 22nd, 2022
CITY OF LONDON:
The number of homes sold increased 15.2% across the city in 2021 over the previous year. 8,029 homes changed hands across London. The number of new listings remained limited based on increasing demand, declining almost 50% in December to 282 new listings across the city.
Based on consumer demand, this drove Months’ Supply down, to about only a month’s supply, this was down from almost 3 months’ supply back at the start of the pandemic. In December, because fewer homes were offered for sale, supply dropped to a record ½ month of inventory. This resulted in the average number of days it takes to sell a home to move down well below the average in 2020. Since March this number has consistently been below 12 days.
This continued limited supply of Homes resulted in extensive “Bidding Wars” in every area of our city. The average “Close Price to List Price Ratio” rose from the lowest rate experience in July 2021 at 105.3% of asking price to a whopping 113.0% of asking prices in December. Demand continues to significantly outpace supply, delivering one consistent result across London “SIGNIFICANT PRICE INCREASES”
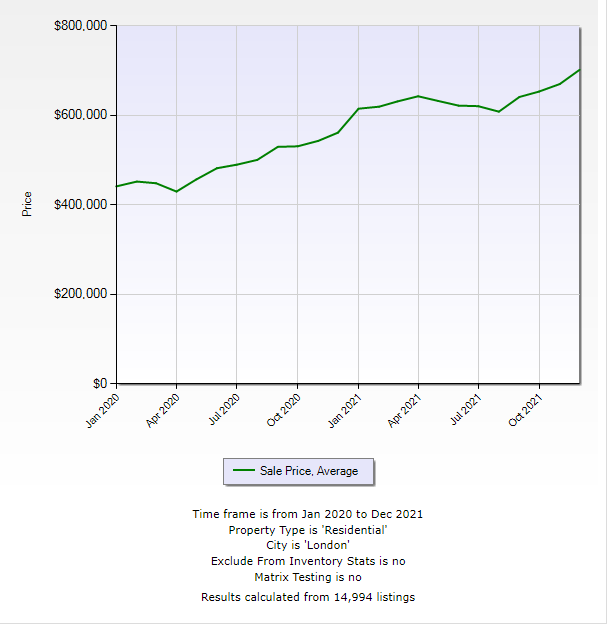
Prices, on a year-over- year average, rose 28% from January 2020 to December 31, 2021. The average homeowner enjoyed an average equity gain of $141,377 year- over-year. The average purchase price of a home in London now sits at $635,613 for the calendar year 2021
. 
JANUARY 2022:
This is the overview for the first month of 2022. 484 new listings came to market in January, pushing available homes offered for sale down marginally from December 2021 to about ¾ of one month of supply. This kept the extensive number of bidding wars in place. In January the average homeowner in the city received a whopping 121.6% of their asking price.
The average selling price for the month of January 2022 outpaced the current yearly average price of $644,841. The average selling price in the city for January 2022 was $770,104
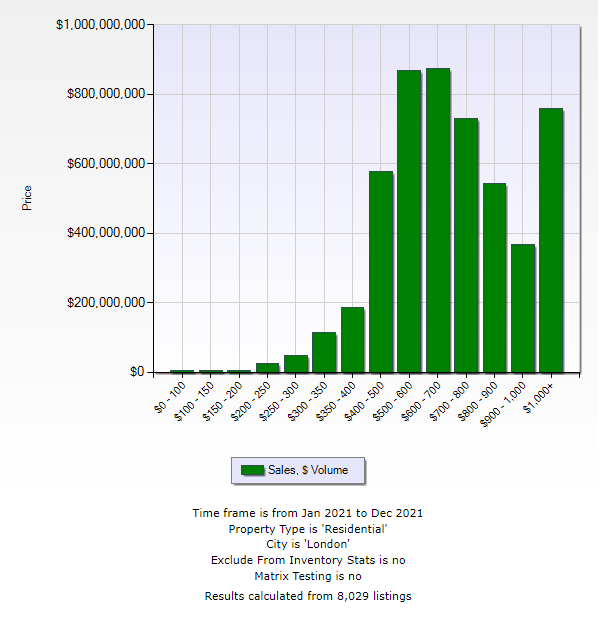
So how do sales, by price point, break out across the city? This graph will explain demand by price category. As you will see 58.7% of all sales in London in 2021 fell into the price categories between $500,000 and $800,000
LONDON NORTH:
Sales increased, over the 2021 calendar year, by 9.7% to 1016 home sold. This was despite the record low number of homes listed for sale. As a result of the continued pressure from lack of inventories, the average number of days to sell a home listed for sale has averaged under 14 days in the last 4 months of the year. Inventories of homes offered for sale have been averaging just over a month’s supply. In December, despite a significant increase in supply over December 2020 the months’ supply fell to less than 80% of the needs for the month.
The limited listings, outlined above, have pushed bidding wars up significantly from an average of 105% of asking prices across the City to over 110% of asking during November and December. In other words, virtually every home listed below the average selling price is involved in bidding wars.
So, what has this done to prices?
Year over year, 2021 versus 2020, homeowners enjoyed an equity gain of 29.7% in London North or an average of $143,684 over the last 12 months, with prices moving to $627,915 from $484,231.
The average selling price for the month of January 2022 outpaced the current yearly average price of $745,937. The average selling price in London North for January 2022 was $753,243. Inventories remain under 1 month’s supply.
Despite the low inventory, the number of homes sold between December 2021 and January 2022 increased 6.9% in London North to 149 homes for January.
LONDON SOUTH:
Sales increased across London South by 17.5% to 3,467 homes changing hands during the 2021 calendar year, despite record low inventories continuing. Inventories have been averaging around 1.5 months of supply in this area consistently since January 2021. The low inventories continuing indicate that virtually every listing is involved in constant “Bidding Wars”. The number of new listings of homes in December 2021 fell to only 163 homes available across London South. The average listing price to selling price average has now risen from single digit increases to double digits over the last two months hitting 111.1% of asking prices.
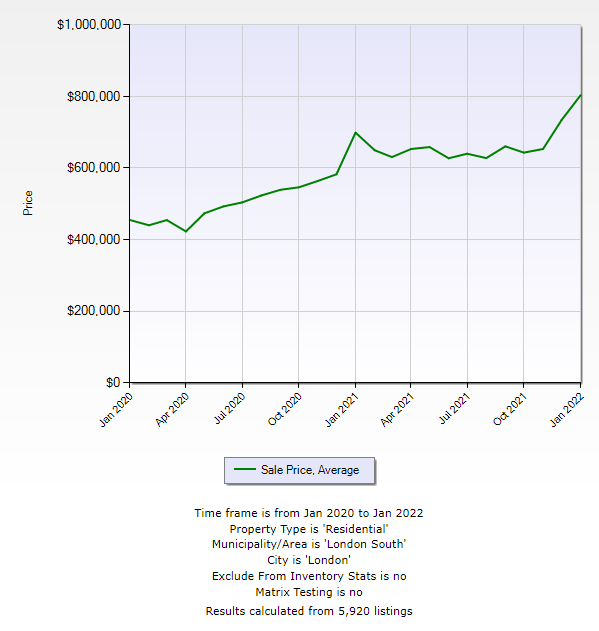
Like the rest of the city, lack of inventory, and continued excessive demand have continued to drive prices upward. The average price rose 27.73% the calendar year 2021 versus 2020 up to $650,211. This increase selling prices put an extra $140,971 of equity gain to existing homeowners’ pockets across London South.
There were 190 homes sold across London South in January 2022. The average selling price based on these 190 sales delivered an average selling price will above the annual average, coming in at $751,347, pushing the 12-month rolling average even higher.
LONDON EAST:
The number of homes sold across London East increased by 23.4% year over year, bringing the yearly sales to 2888 properties in 2021. The number of homes being offered for sale remain limited. However, inventories in this segment of our city remain the highest, sitting constantly at around 2.5 months’ supply since September 1, 2021. This is still very low inventory, and drives up the “List Price to Selling Price Ratio”, which now sits to over 108% of asking for the months of November and December 2021 for the first time since July. On the other side, the number of days it takes to sell the average home in East London had increased steadily from the high teens since the summer. It rose to 26 days in November and up to 29 days in December.
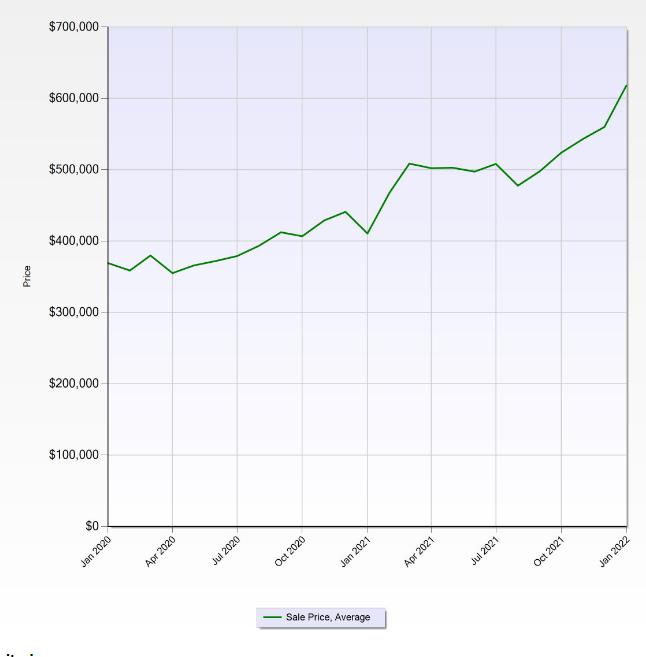
The average price of a home across London East, for the calendar year 2021, rose by 27.9% to $518,413. This put an extra $112,925 in equity gain over 1 year for the average current homeowner. This area continues to offer the best pricing across the city. The average price the calendar year 2020 was $405,488
The number of sales in London East in January 2022 increased only marginally over December coming in 1.8% above December, finishing at 172 homes changing hands. At the same time the “List Price to Selling Price Ratio” rose to the second highest level of the year to 114.7%.
This obviously increased the average Selling Price for the month of January. The average price increase for the month came in at 17% above the yearly average and above the average in December, finishing the month with an average of $606,341
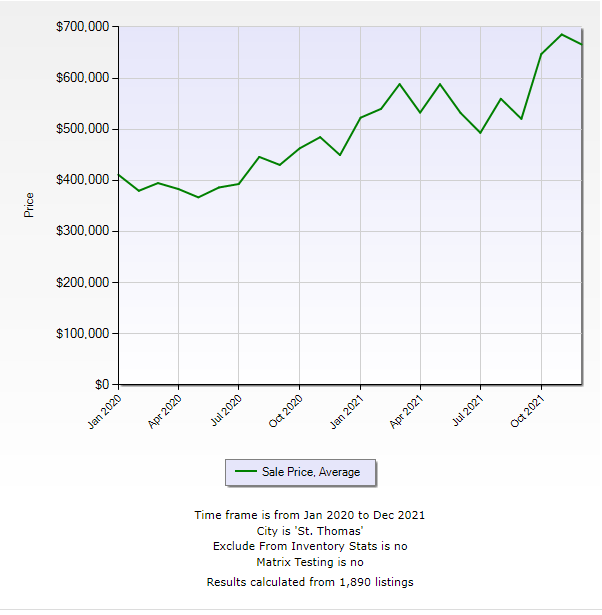
ST. THOMAS:
Sales increased across St. Thomas by 23.7% to 1,074 homes changing hands
during the 2021 calendar year, despite record low inventories continuing. Inventories have been averaging around 1 3/4 months’ supply of homes available for sale consistently since July 2021. The low inventories continuing indicate that virtually every listing is involved in constant “Bidding Wars”. The number of new listings of homes in December 2021 fell to only 72 homes available across St. Thomas. The average “List Price to Selling Price Ratio” has now risen from around 105% for most of the year to an average of 109.4% of asking prices in December.
Like the rest of our area, lack of inventory, and continued excessive demand have continued to drive prices upward. This area has experienced the highest value increase across our area. The average price rose a whopping 37.6% for the calendar year 2021, versus 2020 to $573,134. This increase selling prices put an extra $156,728 of equity gain to existing homeowners’ pockets.
The number homes changing hands decreased from 69 in November to 61 sales in December. The average number of days it took to sell a home decreased back down to 13 days. The Close Price to Listing Price Ratio held at 109.4% which was the same as December 2021. However, the average price for the 61 homes changing hands hit a whopping $1,028,138. Nine homes sold over $900,000 and 3 homes sold over $1,060,000 pushing the average up significantly for the month.
SUMMARY:
What does the future hold? Prices will continue to rise as inventories remain well below demand. First-Time Buyers will be significantly impacted by a financial squeeze by mid-2022. Many will be driven out of the market by record setting inflation and interest rate increases on new mortgages. This will also impact some “Move-up Buyers”, normally selling their homes to First Time Buyers. Top-end homes will continue to sell well, as the moves from large Metropolitan centres, such the Greater Toronto Area, continue.
Right now continues to offer the best purchase price for Buyers wishing to enter the market or move-up! There is no doubt that prices will continue to rise eroding purchasing power in the future.
Remember, as stated, interest rates are going to increase on new mortgage applications or additional mortgage requirements. The proposed 1/2 % by mid-year will affect some first time Buyers. It will translate into mortgage rates above what the bank pays for its currency.
NOW IS STILL THE BEST TIME TO BUY taking advantage of current lower mortgage rates and more equity in your pocket over the months to come.
If you or someone you know would care to take advantage of my 18+ years of Real Experience in effective Marketing, Sales, and Professional Negotiation Skills, call me any time
As always - 519-535-3075 - for direct contact.
Post a comment