Market Trends and Home Sales Across London & St. Thomas in 2022
Sunday Jan 29th, 2023
City of London:
Well, we have just finished the most tumultuous years in Real Estate History, driven by rampant worldwide inflation increases and Bank of Canada interest rate increases virtually every month throughout the year.
What has happened to your home value in the City of London?
Let’s start by looking at the Number of sales taking place each month to determine the Impact of the interest rate increases since early 2022. The highest volume of home sales in 2022 occurred in March during the first interest rate hike with 738 homes changing hands. Even so, this translated into a sales decrease of 21% over 2001 sales in March with 901 homes sold. Since then, the number of homes sold across the city has fallen. They have fallen, month by month, finishing in December with 205 homes selling across the city. This represents a decrease of 41% for the month compared to last year, in December last year, typically the slowest month of the year. It should be noted that since the pandemic began, going back to 2020, it was also the single slowest month of sales in the last 2 calendar years.
This, of course, contributes to an increase in available homes. This inventory has grown month-by-month. In May, through October, inventories ran into the low 1000s for homes available for sale, falling to 751 homes, offered for sale, in December 2022. This is compared to December 2021 when only 116 homes were offered. More importantly, last year the highest number of homes offered for sale in the entire year occurred in June with only 607 homes available for purchase. These levels translate into the highest number of months of supply of homes in the last few years at 4 months’ worth of available homes.
Throughout 2021, it took an average of 8 days, or less, to sell the average home. It now takes over 20 days to sell a home. Bidding wars were everywhere at the start of the year, right through to June 2022. In July, this suddenly changed and has been consistently running at a traditional and historic “Listing to Selling Price Ratio” of around 97% of asking.
So now what has all this done to prices across London in 2022?
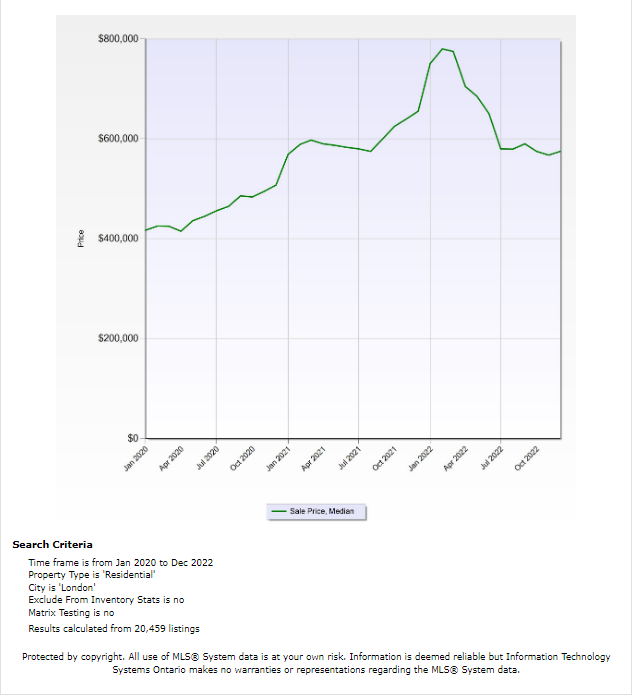
Looking back to 2020, the median average price for the year in a rising market was $455,000. In 2022 the median average price jumped to $585,000. In 2022, in January, we started the year at $751,000 to a peak of $780,000 in February. In March, the Feds began the interest rate climb, month-by-month. This obviously had an immediate impact, forcing buyers to constantly re-apply for their pre-approvals. Prices began to fall month-by-month as buyers withdrew from the market, bottoming at $567,500 in November. Since then, prices had risen marginally, but relatively flat, finishing the year in December at $575,000. It must be remembered that December and January are traditionally the slowest months of the year.
The highest number of sales occur in 5 major price range categories, first is the $600,000 to $700,000 range, followed by $500,000 to $500,000, then $600,000 to $700,000 followed closely by the $400,000 to $500,000 category and finally $800,00 to $900,000. All these categories were similar in volume.
It appears that the Bank of Canada has paused any further increases. Things should remain stable now for the next few months. Prices will remain relatively flat in the short term.
The best advised for “Move-up Buyers” and “First-time Buyers” is lock in your mortgage for 2 or 3 years, before considering a variable rate mortgage. Prices will rise marginally as Buyers begin to return to the market.
London North Overview:
The number of days to sell the average home jumped from January 2022 at 6 days to 24 days by December and based on the excessively low sales volume.
The highest number of active listings occurred across North London in June, at 450 homes offered for sale. The number of homes offered for sale fell month-by-month, as frustrated sellers moved out of the market consistently through to December, at which time inventories dropped to 211 homes offered for sale.
The “Listing to Selling Ratio” now runs close to the rest of the city, sitting at 96.5% of the asking price. Most homes are being offered for sale based on current selling prices.
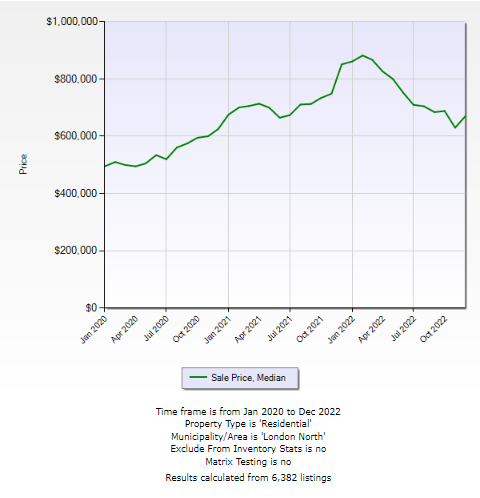
The highest median average price for a home sold in 2022, in London North, occurred in March reaching $867,500. The downward trend, driven by the rise in the bank interest rate increases, began in April and median selling prices finished the year, in December, at $670,000 based on a very low sales volume of 36 homes.
The median average selling price for a home in London North for 2021 sat at $710,400.
In December 2022 Sales fell 40.9% from December 2021. This translates into only 78 sales across London South compared to 132 homes sold the year before.
The number of days it takes to sell the average home jumped from January 2021 from 10 days to 31 days, based on the excessively low sales volume in December 2022.
The highest number of active listings occurred across London South in June, with 521 homes offered for sale. It hovered just below the 500-home level through November. At the end of the year, in the month of December, there were 330 homes offered for sale across London North.
The “Listing to Selling Ratio” now parallels the rest of the city, sitting at 97.1% of the asking price. Most homes are being offered for sale based on current selling prices.
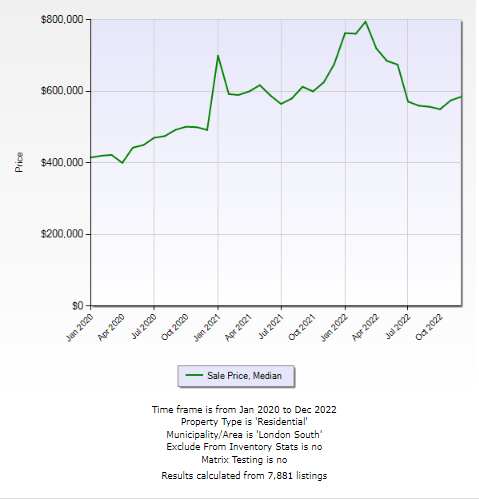
Rate increases began in March and median selling prices finished the year, in December, at $585,000 based on a very low sales volume of 78 homes.
The median average selling price for a home in London South for 2021 sat at $600,100.
London East Overview:
In December 2022 Sales fell 50.2% from December 2021. This translates into only 64 sales across London East compared to 130 homes sold the year before.
The number of days it took to sell the average home jumped from January 2022 at 6 days to 32 days in December based on the excessively low sales volume in December 2022.
The highest number of active listings occurred across London East in July, with 343 homes offered for sale. It hovered around the high 200s through October before declining further in November. At the end of the year, in the month of December, there were 191 homes offered for sale across London East. Driven down by Sellers waiting for better times.
The “Listing to Selling Ratio” now fell below the rest of the city sitting at just over 95.% of the asking price in November and December. Most homes sold are being offered for sale based on current selling prices.
Rate increases began in March and median selling prices finished the year, in December, at $425,000 based on a very low sales volume of 130 homes.
The median average selling price for a home in London East for 2021 sat at $495,000.
St Thomas Overview:
In December 2022 Sales fell 41.7% from December 2021. This translates into only 64 sales across St. Thomas compared to 35 homes sold the year before.
The number of days to sell the average home jumped from January 2022 at 6 days to 26 days based on the excessively low sales volume in December 2022.
The highest number of active listings occurred across St. Thomas in August, with 163 homes offered for sale. It hovered around the mid-100s through November At the end of the year, in the month of December, there were 108 homes offered for sale across London East. Driven down by Sellers waiting for better times.
The “Listing to Selling Ratio” has followed the average for the City of London sitting at just over 97% of the asking price in December. Most homes sold are being offered for sale based on current selling prices.
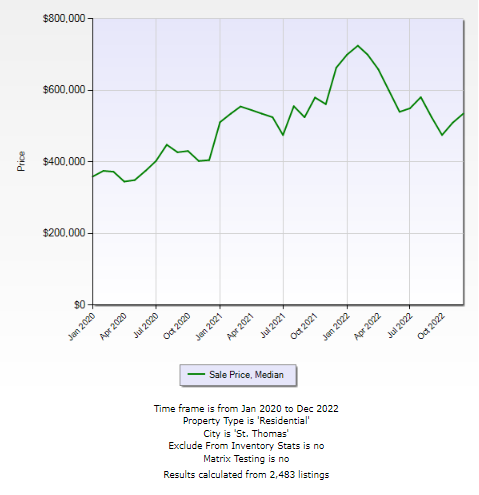
Rate increases began in March and median selling prices finished the year, in December, at $535,000 based on a very low sales volume of 64 homes.
The median average selling price for a home in St. Thomas for 2021 sat at $550,000.
Are you, or someone you know, considering a move or a purchase? Don’t forget I am here always ready to help.
Call me anytime on my cell at 519-535-3975
or email me at
gib@yourfavouriterealtors.com.
I’m ready any time to help or any questions that you may have.
Stay Safe!
Gib Heggtveit
Broker
REMAX Centre City Realty
Post a comment